[header2 text=”Make your data come alive” align=”left” color=”#f58634″ margintop=””]
Excel has made it easier to analyse small or large tables of data using Table Tools. All it takes are few clicks.
[col size=”6″]
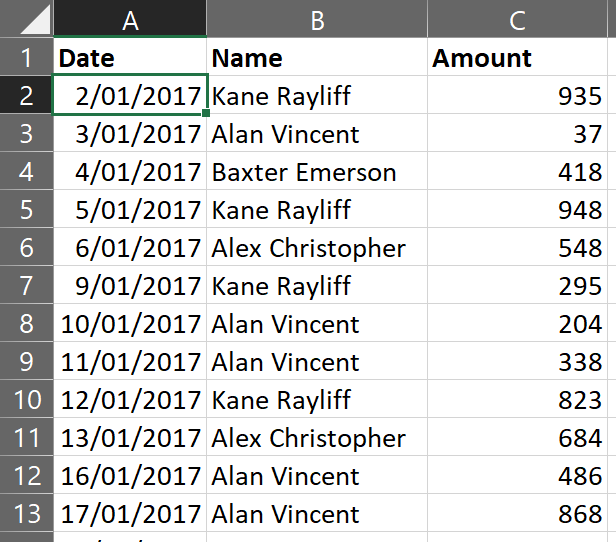
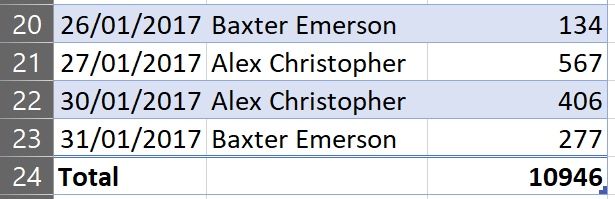
In this example I have a list of expenses for January. Note that the data is laid out in simple columns and rows – you may need to tidy up your data by removing blank rows (and don’t leave any merged cells!!).
[/col]
[col size=”6″]
[/col]
1. Click somewhere in your data
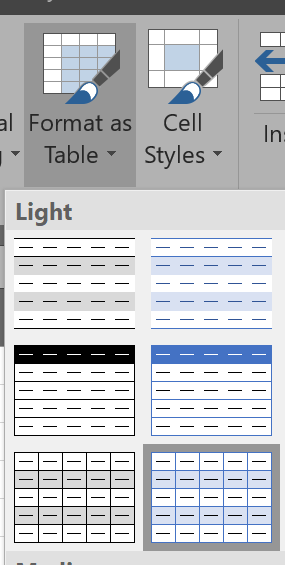
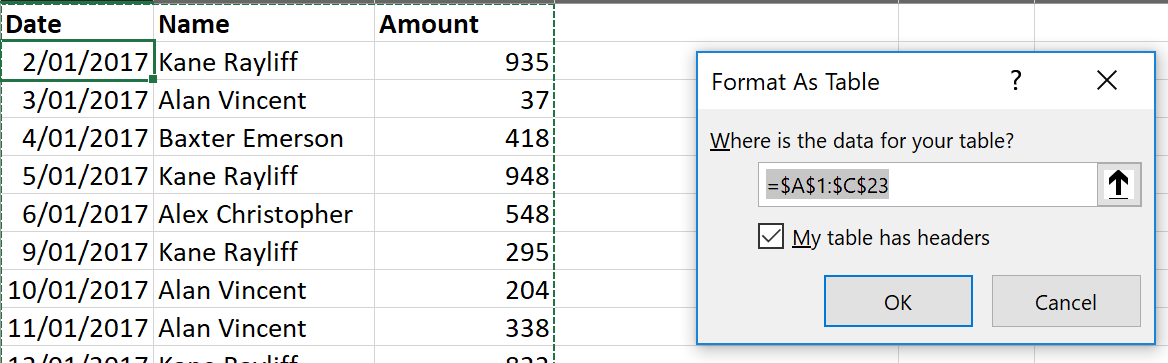
2. Click Format as Table > select a colour > confirm the data location for your table is correct > click OK
3. The ribbon displays the Table Tools tab
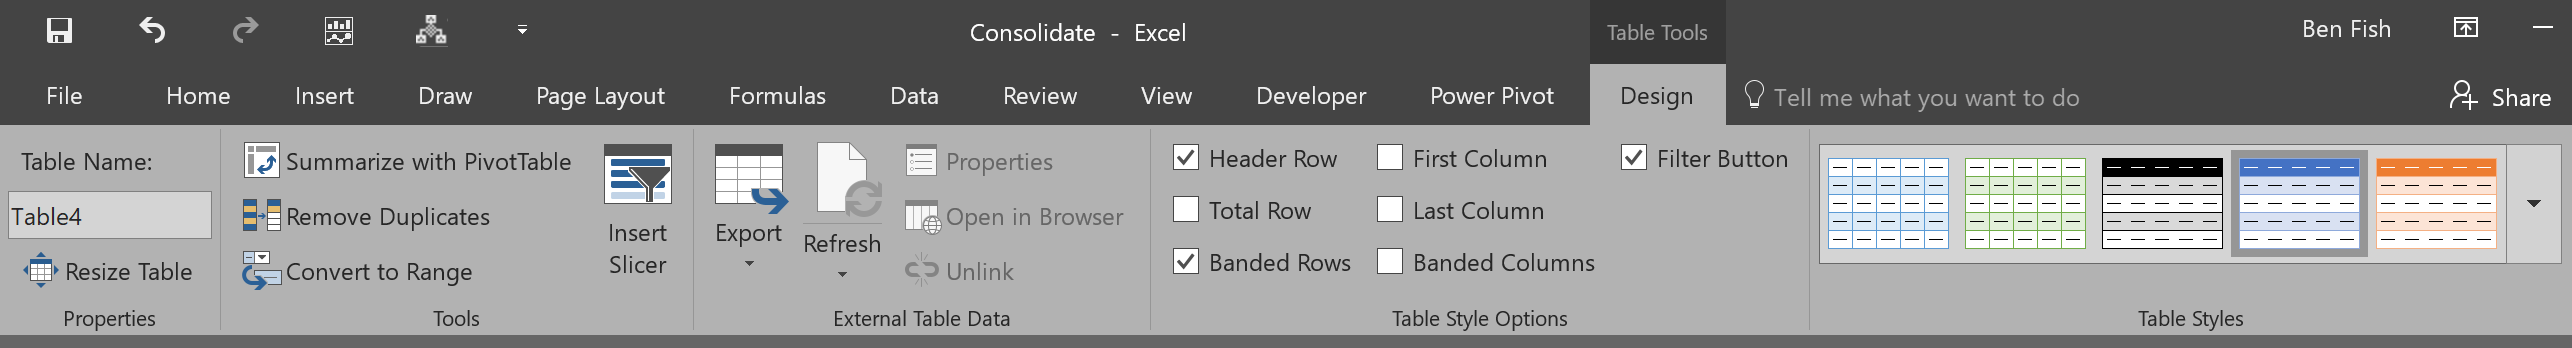
4. Use this to switch on the Total Row to calculate your columns
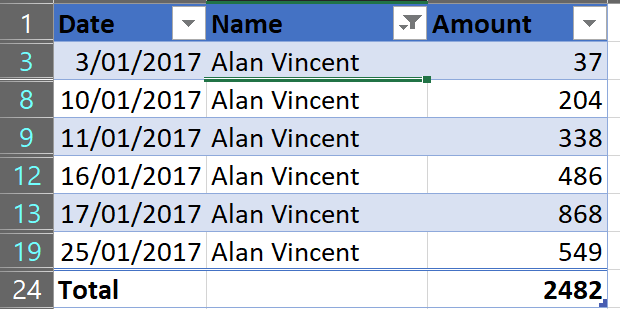
5. Use the filters to select data you wish to focus on
6. Enjoy gushing praise from your boss.
[wow_spacing size=”20px”]